AI-Generated post 18 min to read
Python in Excel Powering Spreadsheets with Code
Enabling advanced data analysis and automation directly within familiar worksheets
Introducing Python in Excel: The Best of Both Worlds for Data Analysis and Visualization
Python, a widely popular programming language, and Excel, a fundamental tool for data organization and analysis, have historically functioned separately. However, Microsoft has recently unveiled the Public Preview of Python in Excel. This integration allows users to combine Python’s robust data analysis and visualization capabilities with Excel’s familiar features. Users can now:
- Analyze and visualize data in Excel using Python’s libraries and plots.
- Further refine insights using Excel’s formulas, charts, and PivotTables.
- Access Python directly from the Excel ribbon without any setup or installation.
- Import external data into Python in Excel workflows using Excel’s built-in connectors and Power Query.
- Collaborate on workbooks and Python analytics using tools like Microsoft Teams and Outlook. Even those without Python in Excel can refresh the analytics for updated information.
- Benefit from enterprise-level security, as Python in Excel operates on the Microsoft Cloud.
Several organizations have already expressed their enthusiasm for this integration. For instance, McKinney highlighted the simplification of their reporting workflows, McGraw Hill emphasized the educational benefits, and KPMG noted the potential for advanced analytics in tax technologies.
Python in Excel is currently being rolled out to the Microsoft 365 Insiders program Beta Channel, starting with Excel for Windows. To access this feature, users need to join the Microsoft 365 Insider Program and select the Beta Channel Insider level.
The integration of Python and Excel has the potential to significantly reshape the landscape of data analysis in several ways:
-
Accessibility and Adoption: Excel is one of the most widely used tools for data manipulation and analysis, especially in the business world. By integrating Python, a powerful programming language known for its data analysis capabilities, more users might be inclined to learn and adopt Python, given the familiar Excel environment.
-
Enhanced Capabilities: While Excel is powerful for data manipulation and visualization, it has its limitations, especially when dealing with large datasets or complex analyses. Python, with its vast libraries like pandas, numpy, and scikit-learn, can handle these complex tasks. This fusion means analysts can leverage both tools in a single environment, expanding the range of analyses they can perform.
-
Streamlined Workflows: Before this integration, data analysts might have had to switch between Python (for data processing and analysis) and Excel (for visualization and reporting). Now, they can have an uninterrupted workflow, increasing efficiency and reducing the chances of errors that can arise from switching between tools.
-
Collaboration and Sharing: Excel’s collaborative features, such as sharing, commenting, and real-time co-editing, combined with Python’s analytical capabilities, can enhance teamwork on data projects. Teams can share not just data but also Python scripts and visualizations, making collaborative data analysis more dynamic.
-
Education and Training: As Python becomes integrated into Excel, there might be a surge in demand for training programs that teach Python for Excel users. This could lead to a new wave of data analysts who are proficient in both tools.
-
Custom Solutions: With Python’s flexibility, businesses can develop custom data solutions and automations directly within Excel, tailoring their data analysis processes to their specific needs.
-
Cloud Integration and Security: Given that Python in Excel runs on the Microsoft Cloud, there’s potential for better integration with other cloud-based services and tools. Additionally, the emphasis on enterprise-level security ensures that data analysis is not only powerful but also secure.
In summary, the fusion of Python and Excel is poised to democratize advanced data analysis, making it more accessible to a broader audience while also offering enhanced capabilities to seasoned analysts. This integration could lead to a new era where data-driven decision-making becomes even more prevalent across industries.
Balancing enhanced collaboration tools with enterprise-level security in Python for Excel can have a profound impact on its adoption rate, both for individual users and organizations:
-
Trust and Reliability: Enterprise-level security ensures that data, especially sensitive or proprietary information, remains protected. Organizations are more likely to adopt a tool when they can trust its security infrastructure. This trust can lead to a higher adoption rate among businesses, especially those in sectors where data security is paramount, such as finance, healthcare, and government.
-
Ease of Collaboration: The collaboration tools allow users to share workbooks, comment, co-author, and integrate with platforms like Microsoft Teams and Outlook. This ease of collaboration can be a significant draw for teams and departments that rely on collective input and review. When a tool promotes seamless teamwork, it’s more likely to be adopted across an organization.
-
Broad Appeal: By catering to both individual and organizational needs, Python in Excel can appeal to a wide range of users. Individual users, such as freelancers or students, can benefit from the enhanced features without feeling overwhelmed by enterprise-focused functionalities. At the same time, large organizations can leverage the tool’s robust security and collaboration features for their teams.
-
Training and Onboarding: The integration of familiar tools (Excel) with new capabilities (Python) can reduce the learning curve. Users familiar with Excel might find it easier to delve into Python when it’s integrated into a platform they already know. This can expedite training and onboarding processes within organizations, further boosting adoption.
-
Cost Efficiency: Organizations often look for solutions that offer multiple functionalities in one platform to reduce costs and streamline operations. Python in Excel provides data manipulation, analysis, visualization, collaboration, and security all in one place, making it an attractive option for cost-conscious businesses.
-
Integration with Existing Infrastructure: Since many organizations already use Microsoft products, integrating Python in Excel into their existing infrastructure can be relatively seamless. This ease of integration can further encourage adoption.
-
Future Development and Support: Given that Python in Excel is backed by Microsoft, organizations can expect regular updates, improvements, and support. This assurance can motivate organizations to invest time and resources into adopting the tool, knowing it will be supported and evolve over time.
In conclusion, the balanced approach of catering to both individual and organizational needs, combined with the tool’s enhanced features, positions Python in Excel for widespread adoption. Its success will, however, also depend on factors like marketing, user feedback, continuous improvement, and the evolving needs of the data analysis community.
While the exact future developments for Python in Excel will depend on user feedback and Microsoft’s strategic decisions, based on current trends in data analysis and software development, we can anticipate several potential integrations and features:
-
Advanced IDE Features: To make coding in Python within Excel more user-friendly, we might see the integration of features commonly found in Python IDEs, such as auto-complete, syntax highlighting, and debugging tools.
-
Integration with Other Microsoft Products: Beyond Excel, Python could be integrated into other Microsoft Office products, such as PowerPoint for dynamic data visualizations or Word for data-driven content generation.
-
Enhanced Data Visualization Libraries: While Python already has powerful visualization libraries like Matplotlib and Seaborn, there might be efforts to develop or integrate libraries specifically optimized for Excel’s environment.
-
Cloud Computing Integration: Given the push towards cloud computing, we might see better integration with Azure services, allowing users to run heavy computations in the cloud directly from Excel.
-
Machine Learning and AI: With Python being a leading language in AI and machine learning, future versions of Python in Excel might offer more streamlined ways to build, train, and deploy machine learning models directly within spreadsheets.
-
Custom Add-ins and Extensions: Just as Excel has add-ins, we might see a marketplace or library for Python-based add-ins or extensions, allowing users to add specific functionalities tailored to their needs.
-
Real-time Data Integration: Enhanced connectors to real-time data sources, such as stock markets, social media feeds, or IoT devices, could be developed, allowing analysts to work with live data streams.
-
Collaborative Coding: Building on Excel’s collaboration tools, users might be able to collaboratively write and debug Python scripts in real-time, similar to platforms like Google Colab.
-
Interactive Widgets: Integration of interactive Python widgets, similar to those in Jupyter notebooks, could allow for dynamic user inputs and real-time data manipulation within Excel.
-
Version Control: Given the importance of version control in coding, there might be integrations with platforms like GitHub or built-in version control systems to track and manage changes to Python scripts within Excel.
-
Enhanced Data Cleaning Tools: Python libraries like pandas are powerful for data cleaning. We might see user-friendly interfaces or tools built on top of these libraries, specifically designed for common data cleaning tasks in Excel.
-
Education and Tutorials: To encourage adoption and help users make the most of Python in Excel, Microsoft might offer integrated tutorials, sample projects, and educational resources.
While these are speculative integrations and features, the fusion of Python and Excel opens a realm of possibilities. The direction it takes will likely be influenced by the evolving needs of users and the broader trends in data science and software development.
Python in Excel: a powerful combination for data analysis and visualization
Integrating Python into Excel emphasizes its potential to revolutionize data analysis and visualization. By merging Python’s robust data analysis and visualization libraries with the familiar features of Excel, users can manipulate and explore data seamlessly. They can utilize Python plots and libraries within Excel and then further enhance their insights using Excel’s formulas, charts, and PivotTables.
The fusion of Python and Excel has the potential to significantly transform the way professionals approach data analysis in several key ways:
-
Unified Platform: Professionals no longer need to switch between separate tools for data manipulation (Excel) and advanced analysis or scripting (Python). This unified platform can lead to more streamlined workflows and reduced inefficiencies.
-
Enhanced Capabilities: While Excel is excellent for basic data manipulation and visualization, Python brings advanced analytical capabilities, including statistical modeling, machine learning, and more. This combination allows professionals to perform both basic and advanced analyses within a single environment.
-
Accessibility: For many professionals, Excel is a familiar tool. By integrating Python into this well-known environment, there’s a lower learning curve, making advanced data analysis more accessible to a broader audience.
-
Automation and Customization: Python’s scripting capabilities can automate repetitive tasks in Excel, from data cleaning to generating reports. This automation can save time and reduce the potential for human error. Additionally, professionals can create custom functions and tools tailored to their specific needs.
-
Dynamic Visualizations: With Python’s rich visualization libraries integrated into Excel, professionals can create more dynamic and interactive visualizations, enhancing data storytelling and insights presentation.
-
Real-time Data Processing: Python’s capabilities can be leveraged for real-time data processing and analysis within Excel, especially beneficial for professionals working with live data streams.
-
Collaborative Data Science: Excel’s collaborative features combined with Python’s analytical capabilities can foster a more collaborative approach to data science. Teams can work together on data analysis projects, sharing Python scripts, data transformations, and visualizations seamlessly.
-
Scalability: Python can handle large datasets more efficiently than Excel alone. Professionals working with big data can leverage Python’s capabilities within Excel, making the tool more scalable for complex projects.
-
Continuous Learning and Upgradation: As the field of data analysis evolves, new Python libraries and tools are continuously developed. Integrating Python with Excel ensures that professionals can always leverage the latest advancements in data science without waiting for Excel-specific features to be developed.
In essence, the fusion of Python and Excel is set to democratize advanced data analysis, making it more integrated, efficient, and accessible. Professionals can expect to conduct more sophisticated analyses faster and with greater ease, leading to richer insights and more informed decision-making.
The integration of Python and Excel’s capabilities opens a plethora of new opportunities for data analysts and enthusiasts:
-
Advanced Data Manipulation: While Excel provides basic data manipulation tools, Python, especially with libraries like pandas, offers more advanced operations. Analysts can perform complex data transformations, aggregations, and filtering with greater ease.
-
Machine Learning and Predictive Analytics: Python is a leading language in the machine learning domain. Within Excel, analysts can build, train, and deploy machine learning models, enabling predictive analytics directly within their spreadsheets.
-
Enhanced Visualizations: Beyond Excel’s standard charts, Python offers libraries like Matplotlib, Seaborn, and Plotly. These allow for more intricate and interactive visualizations, providing richer insights from data.
-
Automation of Repetitive Tasks: Python’s scripting capabilities can be used to automate repetitive tasks in Excel, such as data cleaning, report generation, or regular data updates.
-
Custom Functions and Tools: Analysts can create custom Python functions that can be used directly within Excel, tailoring their analysis environment to their specific needs.
-
Integration with External Data Sources: Python’s vast ecosystem includes libraries for integrating with various data sources, from databases to web APIs. This allows analysts to pull in real-time data or large datasets directly into Excel for analysis.
-
Complex Statistical Analysis: With Python libraries like statsmodels or SciPy, analysts can perform more complex statistical analyses and tests without leaving the Excel environment.
-
Simulation and Optimization: For enthusiasts interested in operations research or simulations, Python’s capabilities can be harnessed within Excel to run simulations, optimizations, or solve complex mathematical problems.
-
Collaborative Data Projects: The collaborative features of Excel combined with Python’s analytical power can lead to more dynamic team projects. Multiple analysts can work on the same dataset, applying different Python scripts or models, and sharing insights seamlessly.
-
Continuous Learning and Skill Enhancement: For enthusiasts, the integration offers a platform to continuously learn and enhance their skills. They can experiment with new Python libraries or techniques directly within a familiar Excel environment.
-
Bridging the Gap between IT and Business: Often, there’s a gap between IT (who might handle more complex data tasks) and business teams. With Python in Excel, business analysts can take on more advanced analytical tasks, fostering better collaboration and faster decision-making.
-
Cost-Efficient Solutions: Small businesses or individual analysts who might not have access to expensive data analysis platforms can leverage Python in Excel to create cost-effective yet powerful data solutions.
In summary, the melding of Python and Excel’s capabilities not only enhances the toolkit available to data professionals but also democratizes advanced data analysis, enabling both seasoned analysts and enthusiasts to explore, innovate, and derive deeper insights from data.
The emergence of tools like Python in Excel signifies a shift in the landscape of data analysis and visualization. As such integrations become more prevalent, we can anticipate several evolutions in the field:
-
Democratization of Data Science: Integrating powerful programming languages into widely-used platforms like Excel makes advanced data analysis techniques accessible to a broader audience. This democratization means that more individuals, regardless of their technical background, can leverage sophisticated data tools.
-
Unified Platforms: The trend might move towards creating all-in-one platforms where data collection, processing, analysis, visualization, and reporting can all be done in one place, streamlining the entire data workflow.
-
Real-time Analysis and Decision Making: With the capability to pull in real-time data and analyze it on-the-fly using tools like Python, businesses can make more timely and informed decisions, adapting quickly to changing situations.
-
Enhanced Collaboration: As these tools become more collaborative, we might see a rise in team-based data projects where analysts, data scientists, and business professionals work together in real-time, sharing insights, visualizations, and models.
-
Customization and Flexibility: The ability to customize analyses using programming languages within standard software means businesses can tailor their data solutions to their specific needs, leading to more relevant and actionable insights.
-
Increased Emphasis on Data Literacy: As advanced tools become more accessible, there will likely be a greater emphasis on data literacy. Organizations might invest more in training their staff to harness the full potential of these integrated tools.
-
Interactive and Dynamic Visualizations: Static charts and graphs might give way to more interactive and dynamic visualizations, allowing users to explore data in more depth and from multiple angles.
-
Shift in Education and Training: Educational institutions and training programs might evolve their curricula to include these integrated tools, preparing the next generation of analysts to work in unified data environments.
-
Integration of AI and ML: With the integration of programming languages, there’s potential for more seamless incorporation of artificial intelligence and machine learning models within data analysis workflows, automating certain tasks and providing predictive insights.
-
Enhanced Data Security: As data analysis tools become more powerful and handle more sensitive information, there will be a heightened focus on ensuring data security, privacy, and compliance.
-
Cloud-based Analysis: The shift towards cloud computing might accelerate, with more data analysis tools offering cloud-based solutions for scalability, collaboration, and integration with other cloud services.
-
Open-source and Community-driven Development: The success of Python, an open-source language, might inspire more community-driven development, leading to a plethora of plugins, extensions, and add-ons that enhance the capabilities of data analysis tools.
In conclusion, the integration of tools like Python in Excel is just the tip of the iceberg. The landscape of data analysis and visualization is poised for significant evolution, driven by technological advancements, changing business needs, and a growing emphasis on data-driven decision-making.
Python in Excel: Elevating your data analysis capabilities
Reference:
- Python in Excel: Elevating your data analysis capabilities by Ndeyanta Jallow, a Product Manager on the Excel team, introduces the Public Preview of Python in Excel. This feature integrates Python and Excel analytics within the same Excel grid, ensuring a seamless workflow.
Key Features:
- Integration of Python and Excel: Excel, a vital tool for data organization and analysis, now integrates with Python, a popular programming language used for data analysis, visualization, machine learning, and more. This integration combines Python’s powerful libraries with Excel’s features, allowing users to analyze data in Excel using Python while also utilizing Excel’s formulas, conditional formatting, and PivotTables.
- Partnership with Anaconda: Microsoft has partnered with Anaconda, a leading enterprise-grade Python repository. Python in Excel uses the Anaconda Distribution for Python running in Azure, which includes popular Python libraries like pandas, stats models, Matplotlib, and seaborn.
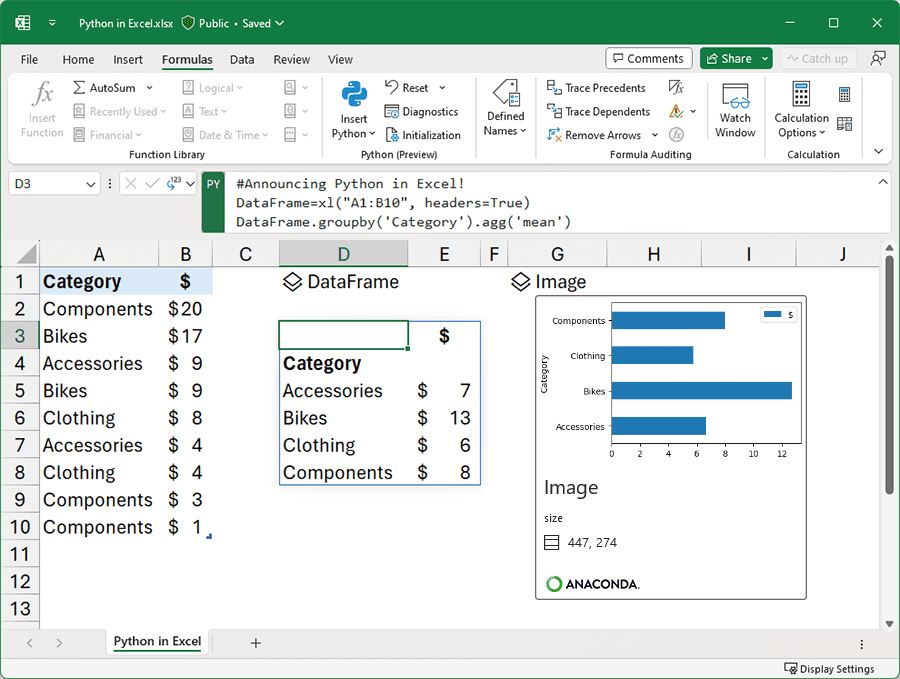
- How it Works: Users can create an Excel worksheet, select a cell, and then choose the option to insert Python. Python in Excel uses a custom function,
xl(), to interface between Excel and Python. This function can accept Excel objects like ranges, tables, queries, and names. The Python code used by Excel runs on the Microsoft Cloud with enterprise-level security. - Scenarios: Users can type formulas directly into a Python cell that references Excel cells using the
xl()function. This can be used to reference individual cells, ranges, or entire tables. - Tips and Tricks: Users can expand the formula bar for multi-line code editing, use Python Output menu to control how Python calculations are returned, and import external data using the Get & Transform feature in Excel.
- Availability: Python in Excel is rolling out to Beta Channel users running specific versions. It is not available on Excel for Mac, Excel on the web, Excel for iOS, or Excel for Android. Some functionalities might be restricted without a paid license after the preview phase.
Further references
- Introducing Python in Excel: The Best of Both Worlds for Data Analysis and Visualization
- https://aka.ms/python-in-excel
- Python in Excel: Elevating your data analysis capabilities
If you are interested in Citizen Development, refer to this book outline here on Empower Innovation: A Guide to Citizen Development in Microsoft 365
| Now, available on | ||||
|---|---|---|---|---|

|
||||

|
||||
|
|
|
|
|
|
If you wish to delve into GenAI, read Enter the world of Generative AI
Also, you can look at this blog post series from various sources.
Stay tuned! on Generative AI Blog Series
We are advocating citizen development everywhere and empowering business users (budding citizen developers) to build their own solutions without software development experience, dogfooding cutting-edge technology, experimenting, crawling, falling, failing, restarting, learning, mastering, sharing, and becoming self-sufficient.
Please feel free to Book Time @ topmate! with our experts to get help with your Citizen Development adoption.
Certain part of this post was generated through web-scraping techniques using tools like Scrapy and Beautiful Soup. The content was then processed, summarized, and enhanced using the OpenAI API and WebPilot tool. We ensure that all content undergoes a thorough review for accuracy and correctness before publication

Comments